
Red List Index of Ecosystems
The Red List Index of Ecosystems (RLIe) tracks changes in ecosystem threat status over time (Rowland et al., 2020). The methods focus the indicator on genuine changes in status by accounting for the impact of improved data at later time points. RLIe scores range from 0 (all ecosystems collapsed) to 1 (all ecosystems classified as Least Concern), providing a clear, comparable measure of ecosystem health across time and space. RLIe was calculated for 463 terrestrial ecosystems at the biome level, across four RLE assessment periods: 2014, 2018, 2020, and 2024. The emerging trends reveal a complex picture of both resilience and vulnerability across South Africa’s biomes.
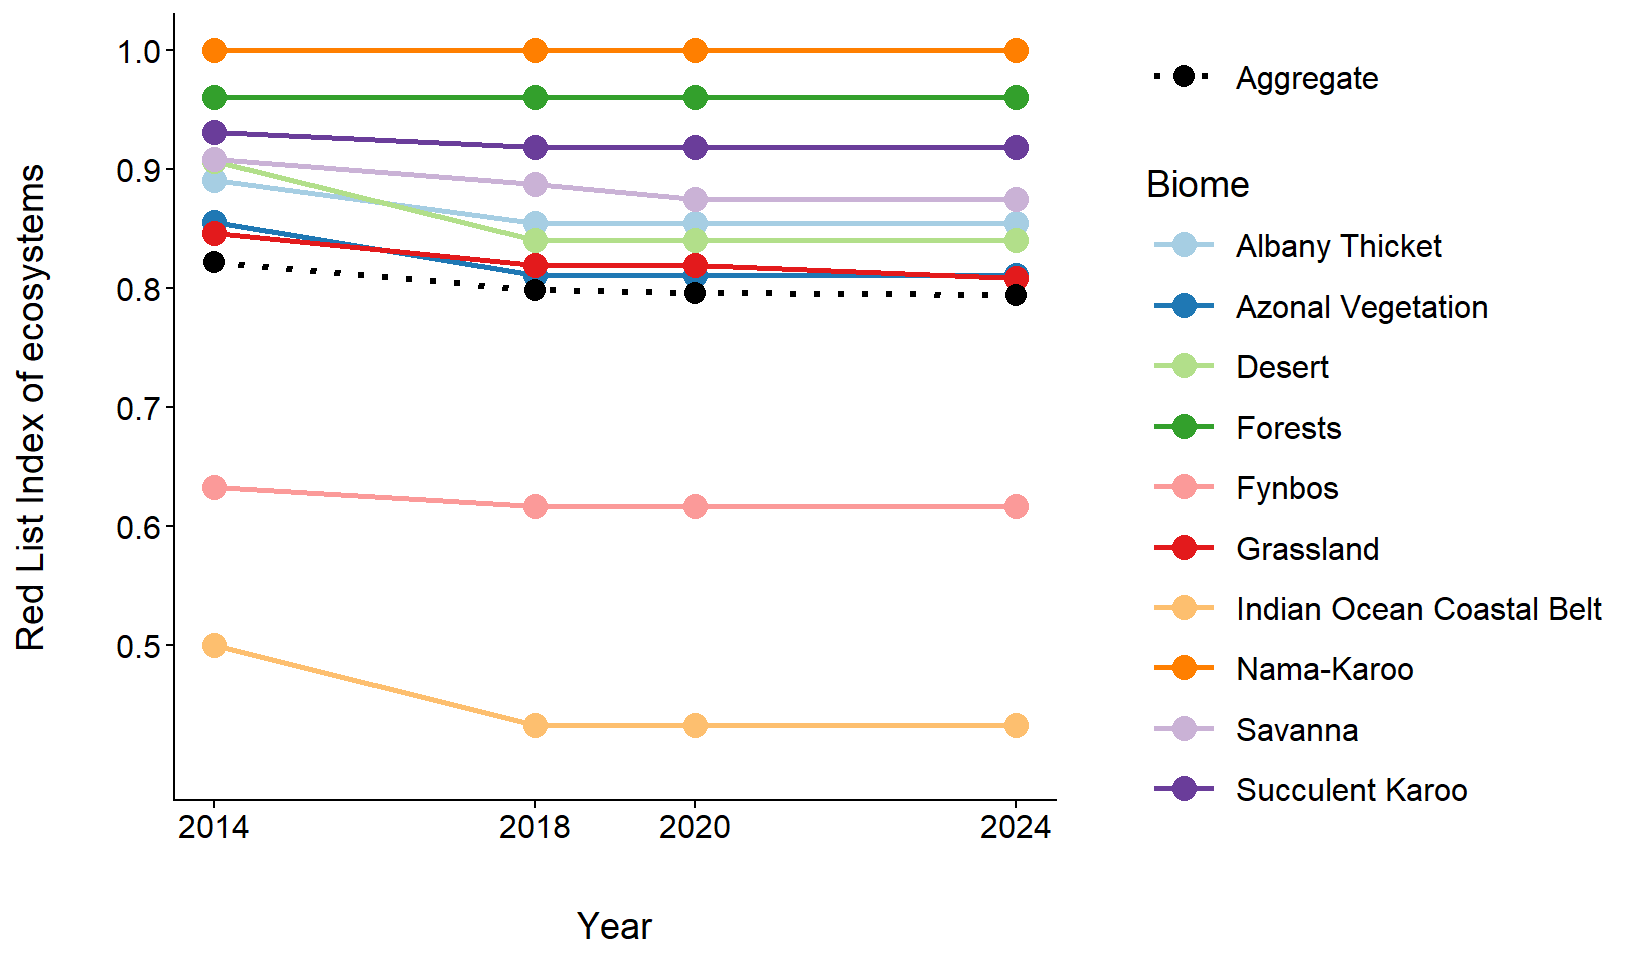
The Indian Ocean Coastal Belt has experienced the steepest decline and has the lowest overall RLIe, falling from 0.50 in 2014 to 0.43 in 2024. All ecosystem types in this biome are threatened and over time they are moving into higher risk categories. This steep downward trend reflects growing pressures from land-use conversion, including the expansion of croplands, urban development, and plantations. The Fynbos Biome, renowned for its exceptional biodiversity, faced substantial historical pressures resulting in low RLIe scores (0.62) but these are reasonably stable since 2018 suggesting that the main drivers of change, particularly agricultural pressure in lowland areas, have been entrenched for many years. In the Desert, Albany Thicket and Grassland biomes there are fewer threatened ecosystems and hence slightly higher RLIe (~0.8) but these scores have dropped substantially since 2014, suggesting accelerating pressures.
At the national level, South Africa’s overall RLIe declined slightly from 0.82 to 0.79 between 2014 and 2024, signaling a slow but steady increase in ecosystem threat. The divergent trajectories seen across individual biomes highlight the importance of targeted, biome-specific conservation efforts to address the primary drivers of change shaping ecosystem threat status across the country.